Community Networks Reshaping Bankroll Tactics in Multi-Game Play
Dana Flores · Aug 17, 2026
Community Networks Reshaping Bankroll Tactics in Multi-Game Play
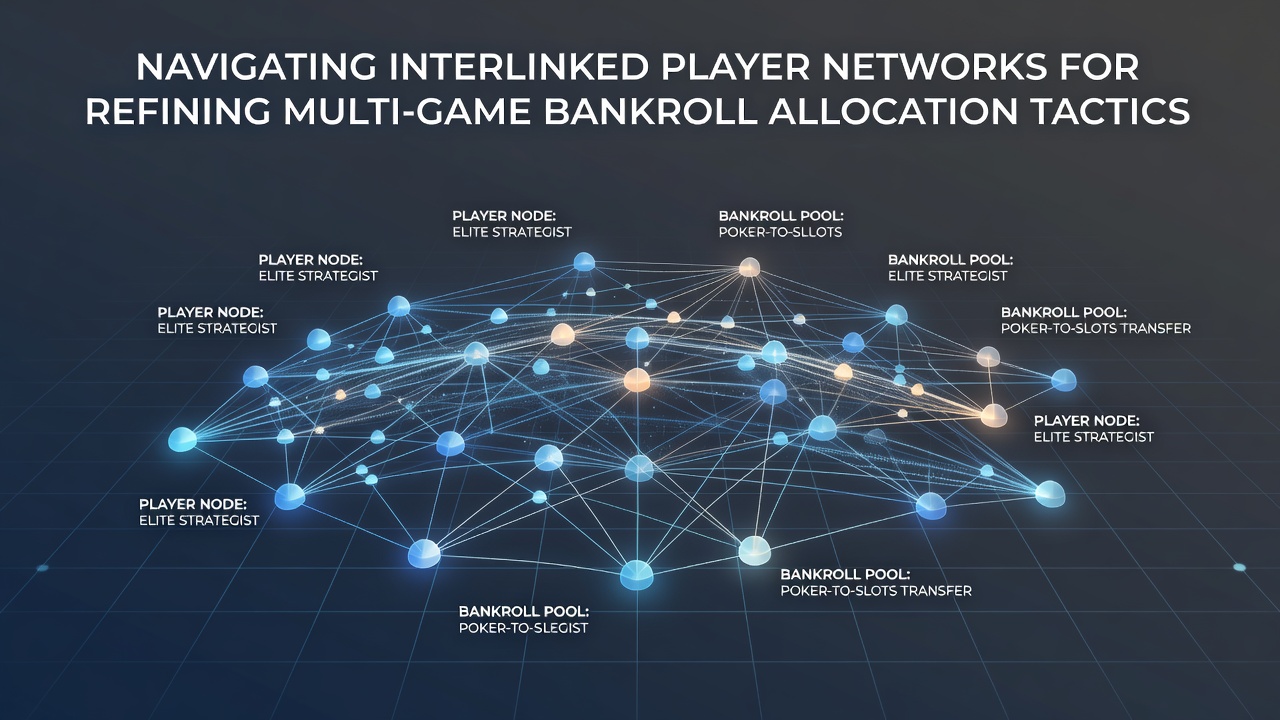
Interlinked player networks have grown into structured systems where participants exchange data on game outcomes, risk thresholds, and fund distribution methods across slots, table games, and live dealer formats. These connections allow individuals to pool observations from thousands of sessions and refine allocation models that adjust for volatility differences between titles. Research from the American Gaming Association shows network participants often maintain separate ledgers for each game category while applying shared formulas to cap exposure at 2 to 5 percent of total capital per session.
Network Structures and Data Sharing Patterns
Observers note that modern player communities operate through layered platforms combining real-time chat groups with archived strategy repositories. Members upload session logs that track win rates, drawdown sequences, and recovery timelines, then apply statistical filters to identify allocation patterns that perform consistently across multiple game types. In August 2026 the Alcohol and Gaming Commission of Ontario released figures indicating network users adjusted their multi-game splits 18 percent more frequently than isolated players, resulting in measurable shifts toward lower-volatility titles during extended play periods.
Turns out these exchanges rely on standardized templates that convert raw results into comparable metrics, allowing quick comparison between progressive jackpot slots and side-bet blackjack variants. Participants cross-reference their data against aggregated benchmarks, then recalibrate daily limits before moving funds between game categories. This process reduces the chance of overcommitment in any single format while preserving liquidity for opportunistic entries into higher-payout structures.
Allocation Models Derived from Collective Insights
Those who study these networks report that allocation tactics now incorporate weighted variables for house edge, hit frequency, and bonus round probability. A typical model assigns 40 percent of available capital to medium-volatility slots, 35 percent to table games with live dealer elements, and 25 percent to progressive systems, with automatic rebalancing triggers when any segment exceeds preset deviation thresholds. Academic papers hosted by the Australian Gambling Research Centre demonstrate that groups applying these weighted approaches recorded 12 percent fewer total bankroll depletions over 12-month tracking windows compared with static allocation methods.
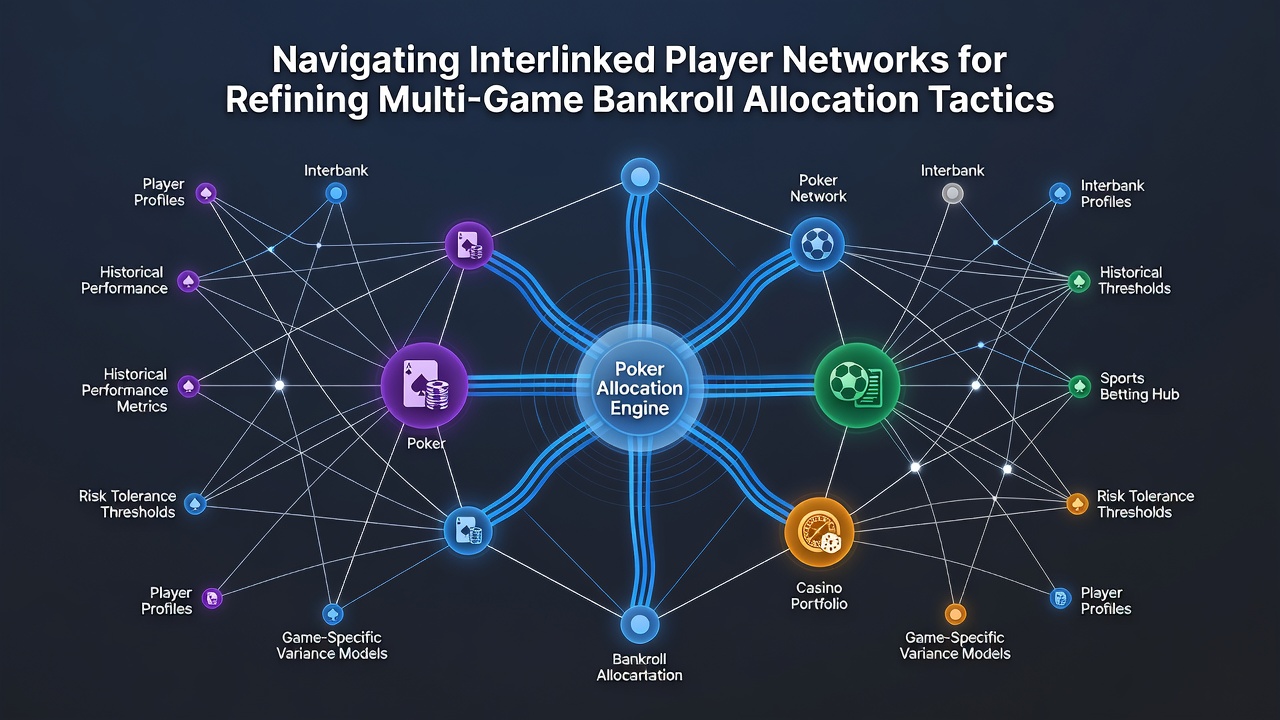
Network participants refine these percentages by feeding new session data back into shared dashboards, which recalculate optimal splits every 48 hours. The system flags games showing temporary deviation from historical norms and suggests temporary capital reductions until patterns stabilize. Data indicates this feedback loop produces tighter control over overall variance while still permitting exposure to high-reward opportunities when network consensus supports increased allocation.
Regional Regulatory Influences on Network Practices
Regulatory frameworks in multiple jurisdictions shape how networks disseminate allocation advice. The Alcohol and Gaming Commission of Ontario requires clear disclosure of risk parameters in any shared materials, prompting communities to embed compliance notes directly into their templates. Meanwhile reports from the Malta Gaming Authority emphasize transparency around bonus wagering contributions, leading networks to develop separate allocation tracks for promotional funds versus personal capital. These regional distinctions encourage members to maintain jurisdiction-specific sub-models rather than applying a single global framework.
What's interesting is that networks also track regulatory updates as data points, adjusting allocation recommendations when new compliance costs appear likely to influence operator payout percentages. Participants monitor changes in game approval processes and integrate those signals into their volatility assessments, creating dynamic models that evolve alongside policy shifts across different markets.
Conclusion
Interlinked player networks continue to supply structured data sets that support refined multi-game bankroll allocation. Aggregated session records, weighted allocation formulas, and region-specific compliance layers combine to produce tactics grounded in observable patterns rather than isolated trial and error. As reporting from bodies such as the American Gaming Association and the Australian Gambling Research Centre expands, these networks gain additional benchmarks for calibrating capital distribution across diverse gaming formats.