Charting Aggregated Data Streams on Side Bet Choices Across Dealer Blackjack Tables
Dana Foster · Aug 19, 2026
Charting Aggregated Data Streams on Side Bet Choices Across Dealer Blackjack Tables
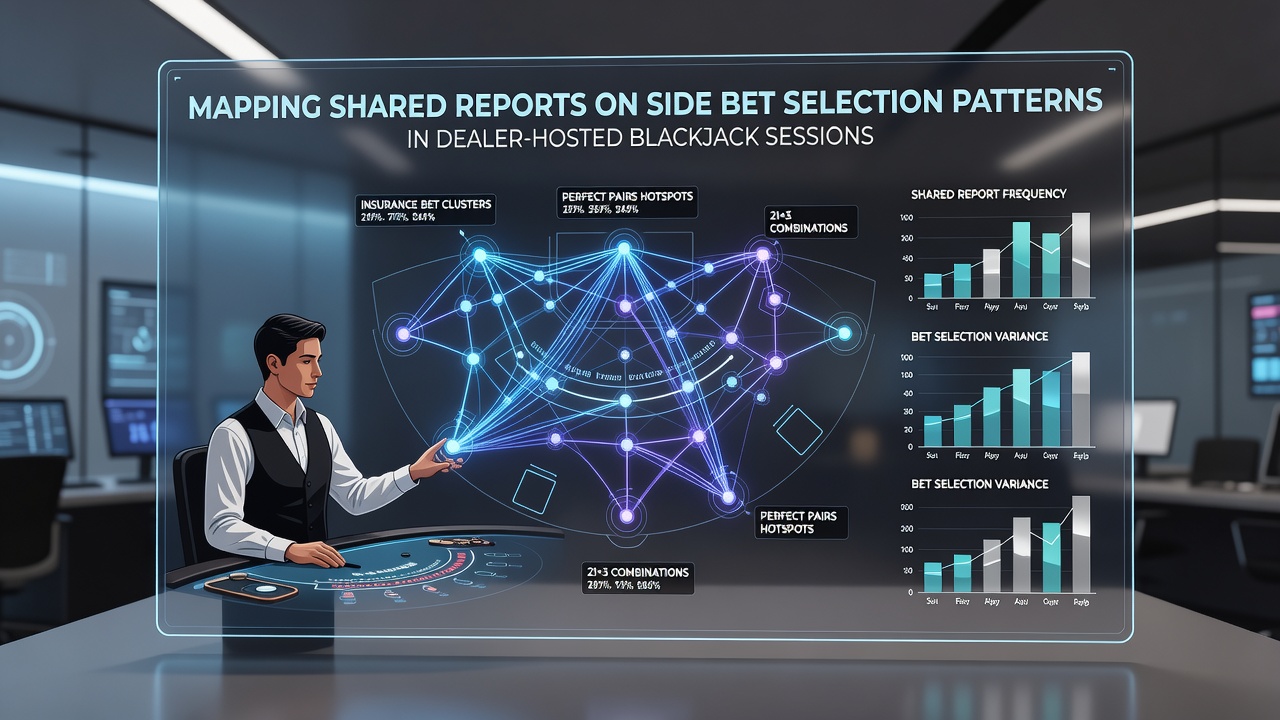
Reports compiled from multiple dealer-hosted blackjack sessions highlight recurring patterns in side bet selections, with data drawn from player tracking systems and session logs spanning several jurisdictions. These shared datasets focus on bets such as Perfect Pairs, 21+3, and insurance options, revealing how participants distribute wagers during live rounds. Analysts compile information from casino floor records and digital reporting tools to map frequency distributions, bet sizing, and timing sequences.
Core Elements of Side Bet Reporting
Side bet categories break down into pairs-based wagers, three-card combinations, and protection bets against dealer blackjack. Shared reports indicate that pairs-based selections occur at higher rates when tables feature multiple decks, while three-card bets cluster around hands with ace or face card visibility. Data aggregation platforms pull from session timestamps to identify clusters, such as increased insurance uptake during high-stakes segments where dealer upcards reach ten-value positions.
Mapping techniques apply heat-map overlays to session transcripts, connecting individual selections to preceding card distributions and player positions. Those who review these maps note consistent spikes in certain bets during evening shifts across monitored venues, with volume metrics rising in correlation to table occupancy levels.
Data Sources and Collection Methods
Collection relies on anonymized logs from electronic table systems and voluntary player submissions processed through industry monitoring services. Figures from the Nevada Gaming Control Board show side bet participation rates holding steady near 18 percent of total wagers in live blackjack environments during early 2026. Cross-referenced inputs from Australian gaming oversight bodies add regional layers, illustrating how selection frequencies shift when progressive jackpot side bets integrate with standard options.
Researchers cross-verify entries against video archives from dealer-hosted tables to confirm bet placement accuracy. This process filters out anomalies and builds layered visualizations that track progression across consecutive hands.
Observed Selection Patterns in Recent Sessions
Patterns emerge around card count thresholds and dealer exposure. Shared reports document elevated 21+3 activity when initial two-card totals reach 15 or higher, with average bet amounts scaling alongside table minimums. Insurance selections align more closely with visible ten-value upcards in multi-deck formats, while pair bets concentrate in single-deck or double-deck variants during early shoe cycles.
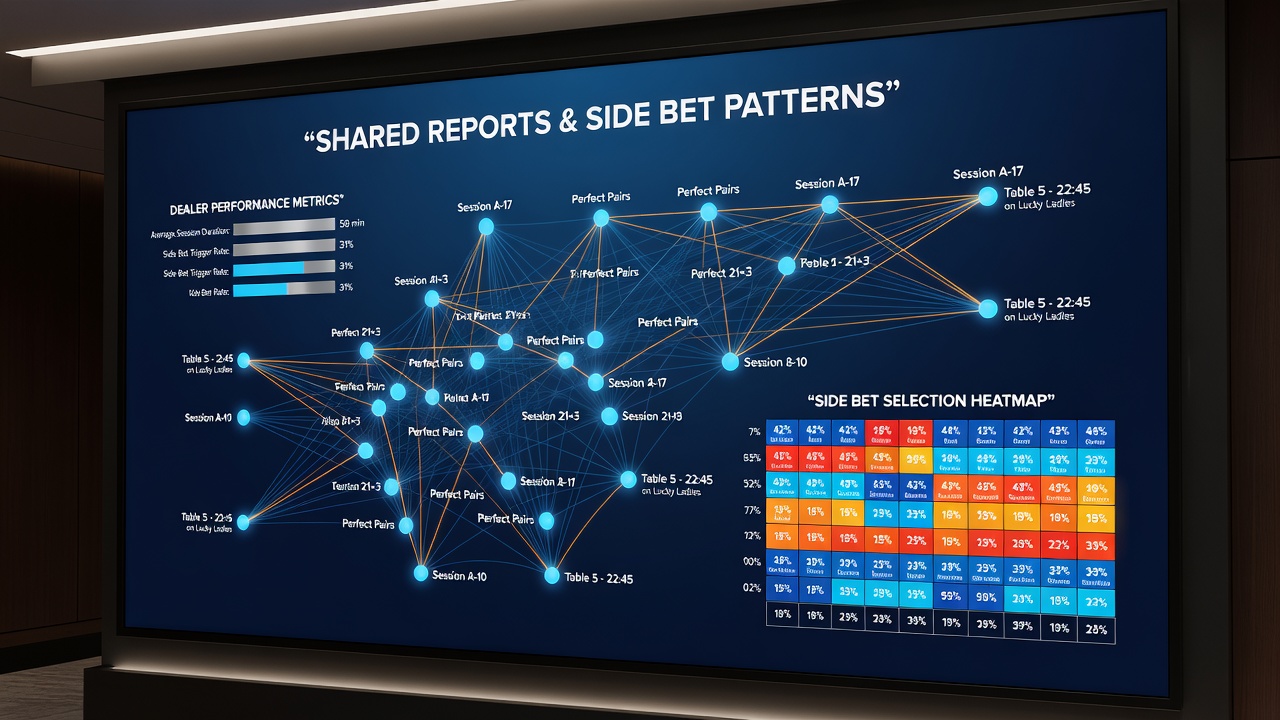
Timing data further refines these observations. Selections for protection bets increase after sequences of non-blackjack dealer hands, creating measurable upticks documented in August 2026 session compilations. Those reviewing the maps identify recurring loops where players alternate between pairs and three-card bets based on prior outcomes, forming traceable decision trees within the aggregated records.
Regional and Venue Variations
North American venues report higher volumes of insurance-linked side bets compared to European sites, where three-card combinations dominate shared logs. Canadian provincial data from regulatory summaries adds context, showing seasonal fluctuations tied to tourism peaks that influence overall side bet ratios. Venue size plays a documented role, with larger operations displaying broader pattern spreads across multiple table configurations.
Cross-border comparisons reveal that progressive side bet inclusions alter baseline frequencies, pushing participants toward higher-variance options in linked jackpot environments. Mapping tools adjust for these differences by normalizing against base game volumes, allowing clearer pattern isolation.
Analytical Tools Applied to Shared Reports
Visualization software processes raw session data into node-link diagrams that connect bet types to card outcomes and player demographics. These diagrams expose clusters where specific side bet combinations repeat under similar shoe conditions. Academic studies from institutions tracking gambling behavior supply additional frameworks for interpreting frequency shifts without introducing external assumptions.
Session length metrics integrate into the maps, demonstrating how extended play periods correlate with diversified side bet menus. Observers note that shorter sessions tend toward conservative selections, while prolonged rounds feature expanded variety across the documented datasets.
Conclusion
Aggregated reports continue to supply structured insights into side bet dynamics within dealer-hosted blackjack environments. The mapped patterns support ongoing refinement of data collection protocols across monitored jurisdictions, with emphasis on consistent categorization and timing alignment. Future updates to these shared resources will incorporate expanded venue inputs to maintain comprehensive coverage through subsequent reporting cycles.